3 WorldClim
WorldClim is a project created by Robert J. Hijmans, Stephen E. Fick, and colleagues that provides high-resolution global climate data for spatial mapping and modeling (Fick & Hijmans, 2017). These datasets include historical series downscaled from CRU-TS-4.09, containing data interpolated from thousands of weather stations, as well as future projections derived from Coupled Model Intercomparison Project Phase 6 (CMIP6) models.
When used with agent-based models, WorldClim data can help simulate the effects of climate change on species distributions, ecosystem dynamics, and human-environment interactions, adding structural realism and complexity to simulations. LogoClim does the heavy lifting of integrating these datasets into NetLogo, allowing you to focus on your research questions and model design.
3.1 Data Series
LogoClim supports simulation with all three climate data series provided by WorldClim 2.1. Each series is available at multiple spatial resolutions, from 10 minutes (~340 km² at the equator) to 30 seconds (~1 km² at the equator).
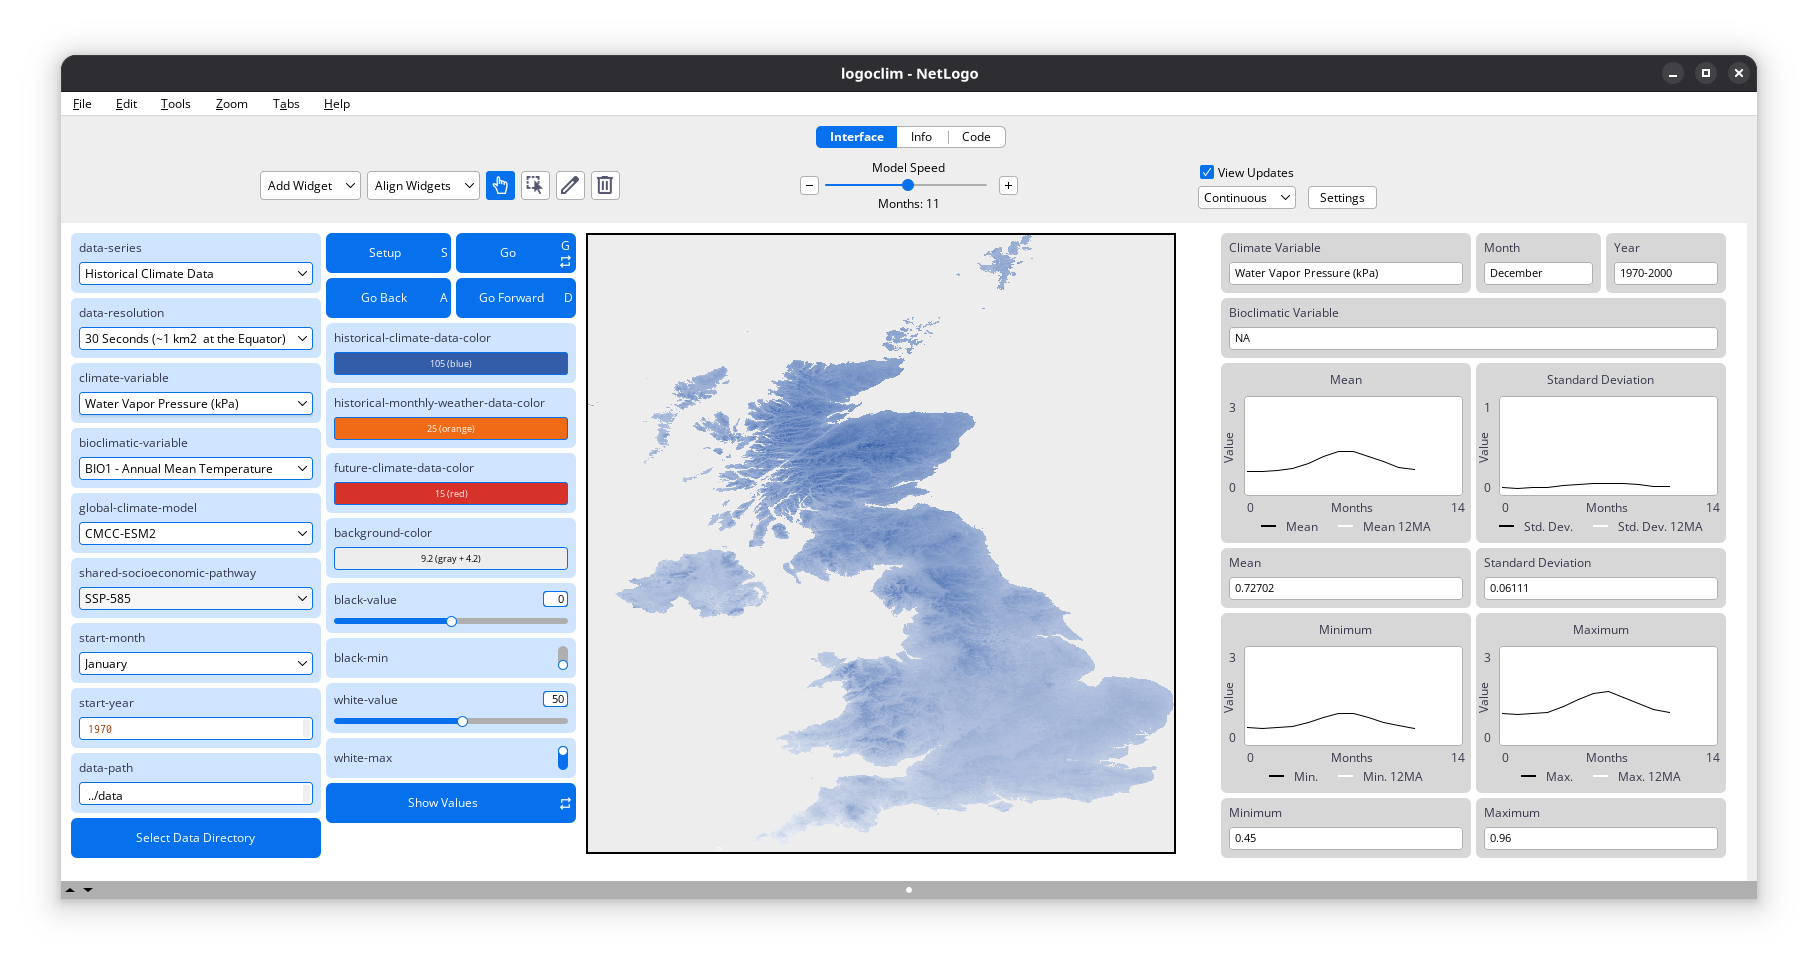
3.1.1 Historical Climate Data
This series includes only 12 monthly data points representing long-term average climate conditions for the period 1970-2000. It provides averages on minimum, mean, and maximum temperature, precipitation, solar radiation, wind speed, vapor pressure, elevation, and on bioclimatic variables.
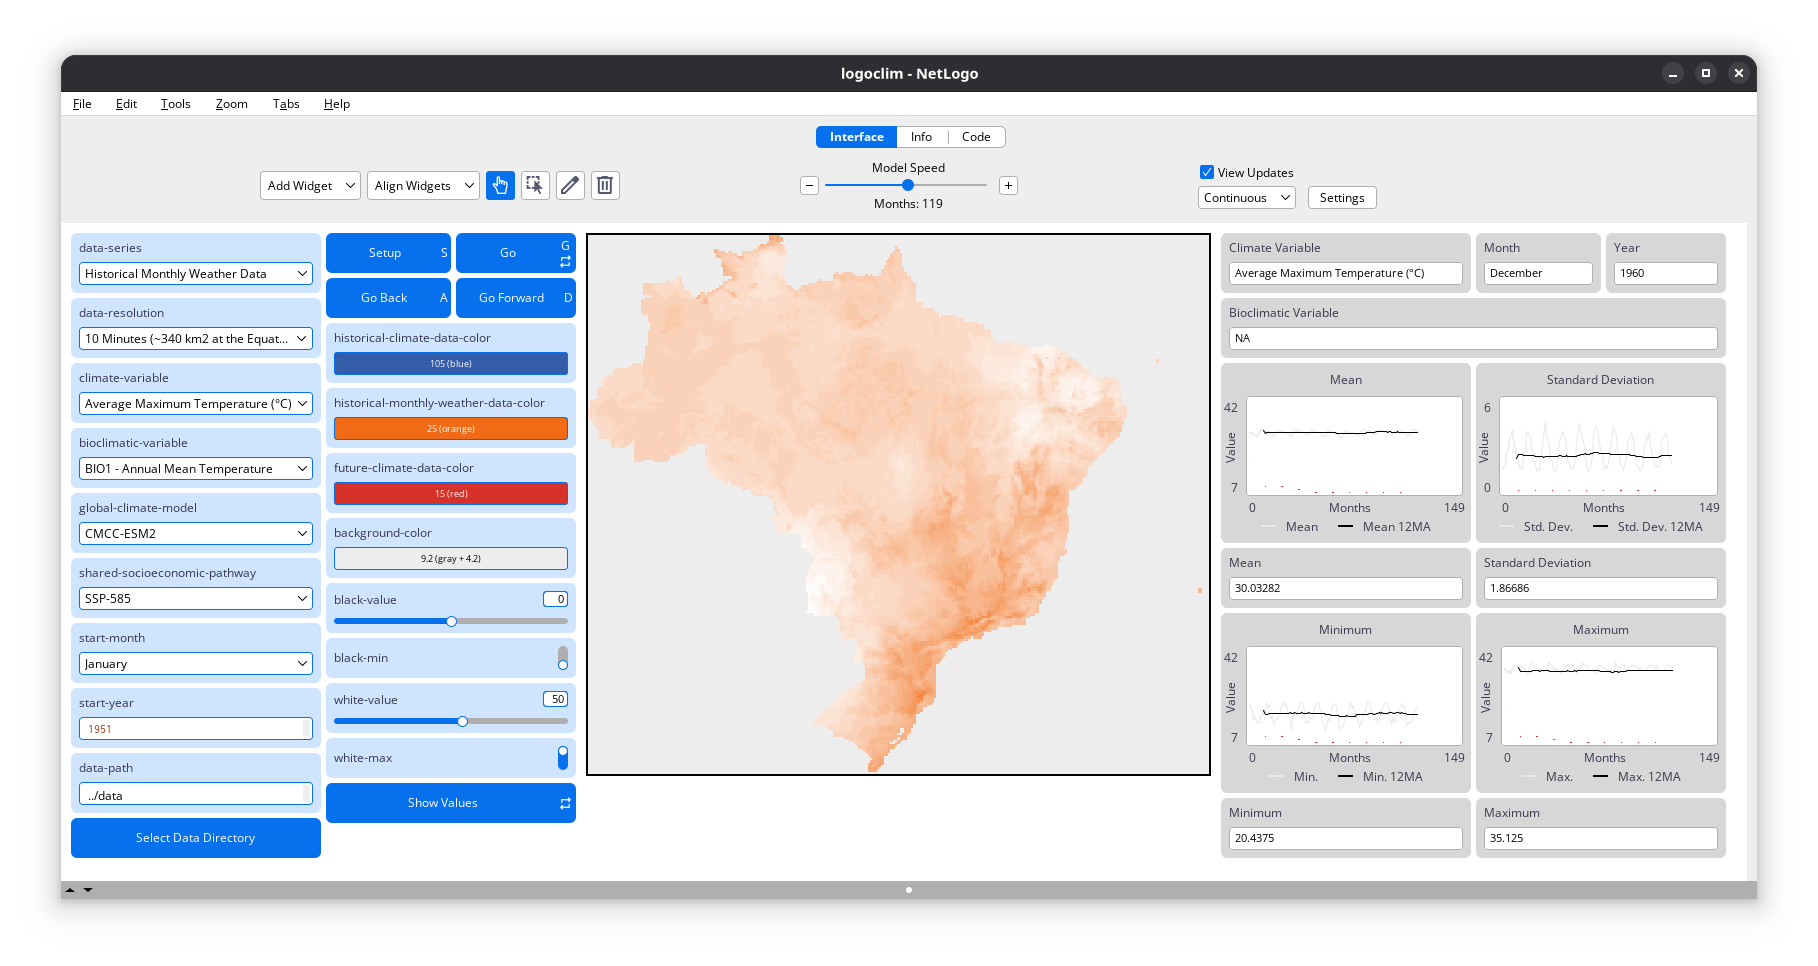
3.1.2 Historical Monthly Weather Data
This series includes 12 monthly data points for each year from 1951 to 2024, based on downscaled data from CRU-TS-4.09, developed by the Climatic Research Unit at the University of East Anglia. It provides monthly averages for minimum temperature, maximum temperature, and total precipitation.
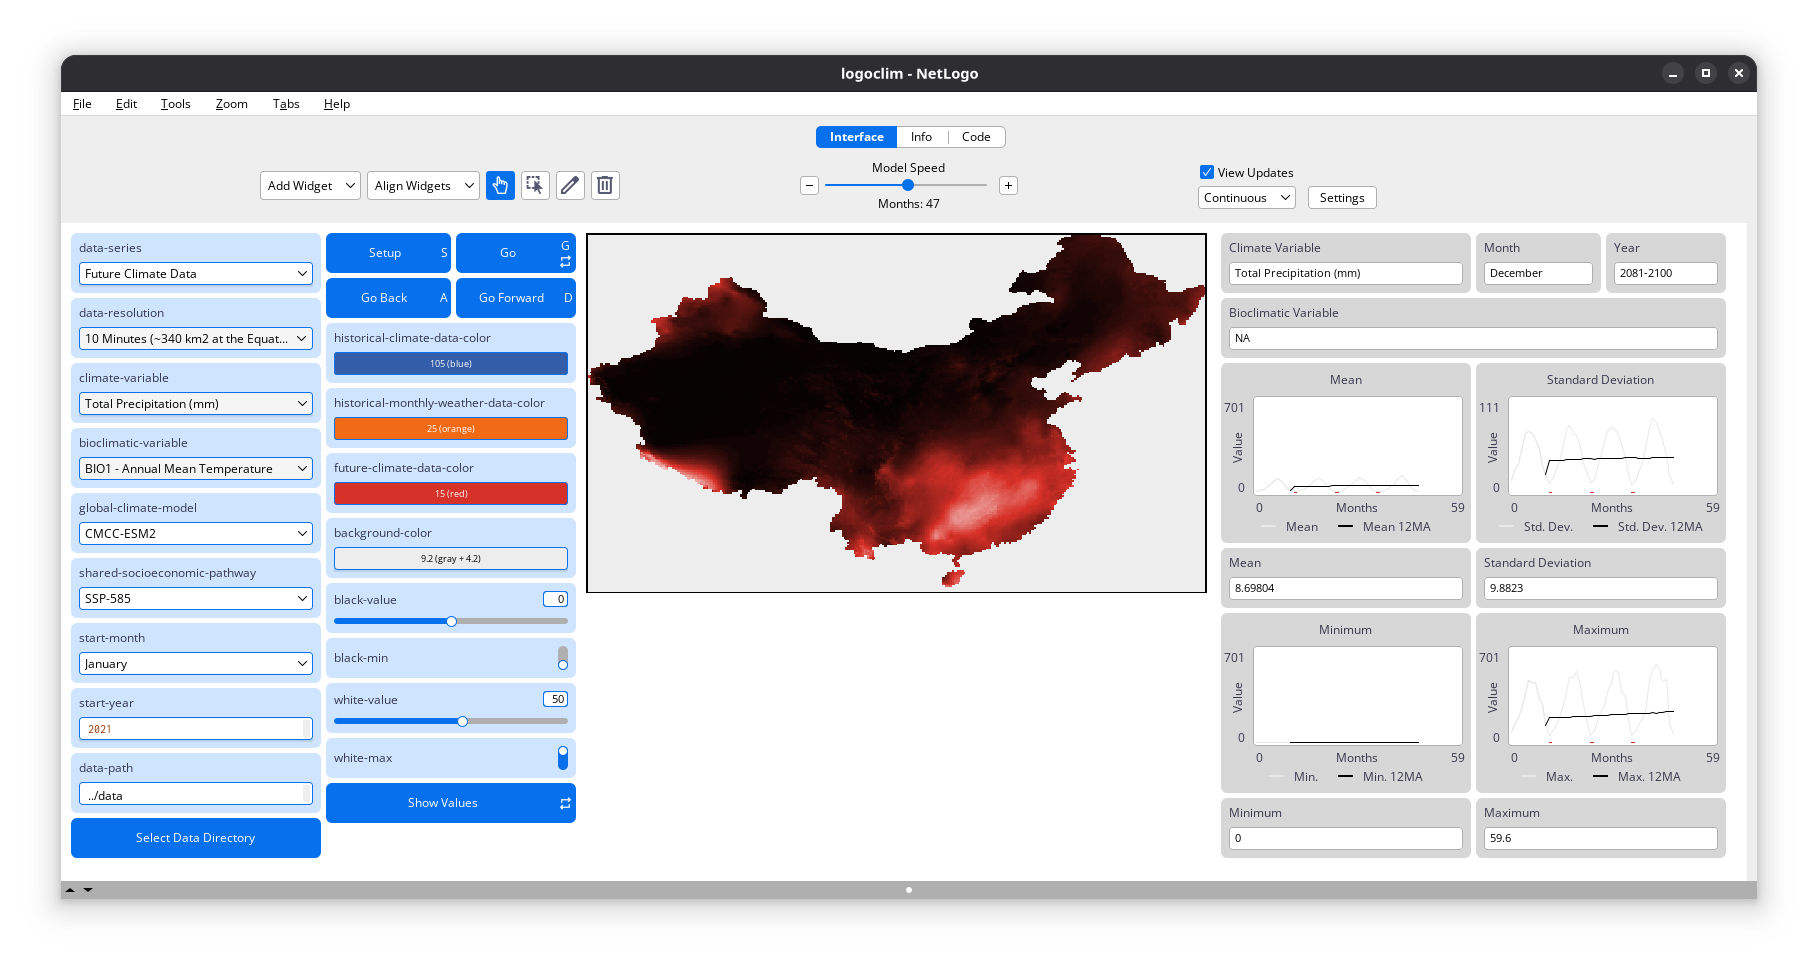
3.1.3 Future Climate Data
This series includes 12 monthly data points from downscaled climate projections derived from CMIP6 models for four future periods: 2021-2040, 2041-2060, 2061-2080, and 2081-2100. The projections cover four SSPs: 126, 245, 370, and 585, with data available for average minimum temperature, average maximum temperature, total precipitation, and bioclimatic variables.
3.2 LogoClim Data
LogoClim uses raster data to represent climate variables. Datasets come from WorldClim 2.1, but need to be converted to Esri ASCII format before NetLogo can read them. To take care of that, we developed two functions in the orbis R package (Vartanian, 2026) that handle the extraction and conversion for you:
-
worldclim_download(): Download WorldClim data -
worldclim_to_ascii: Convert WorldClim GeoTIFF files to Esri ASCII Grid
Using these functions requires some familiarity with R programming language and its ecosystem. The next sections walk you through how to use them. If you are new to R, Hadley Wickham’s (2023) R for Data Science and Garrett Grolemund’s (2014) Hands-On Programming with R are both great free resources to get you started.
We also plan to bring similar functionality to Python down the road. If you are interested in contributing to this effort, feel free to reach out through the project’s GitHub repository.
3.3 License
It’s important to note that WorldClim data is freely available only for non-commercial use. If you wish to use the data in commercial settings, you must obtain permission from the WorldClim team.
Here is a summary of the licensing terms:
The data are freely available for academic use and other non-commercial use.
Redistribution or commercial use is not allowed without prior permission.
Using the data to create maps for publishing of academic research articles is
allowed. Thus you can use the maps you made with WorldClim data for figures in
articles published by PLoS, Springer Nature, Elsevier, MDPI, etc. You are
allowed (but not required) to publish these articles (and the maps they contain)
under an open license such as CC-BY as is the case with PLoS journals and may be
the case with other open access articles.

Please send your questions to info@worldclim.org
Find more about the WorldClim licensing terms here.
3.4 Literature
Each dataset is accompanied by literature detailing its creation, methodology, and potential applications. Always refer to the WorldClim website for proper citation guidelines and to access the most current and relevant references for your work.
The main references are the ones below:
Fick, S. E., & Hijmans, R. J. (2017). WorldClim 2: New 1-km spatial resolution climate surfaces for global land areas. International Journal of Climatology, 37(12), 4302–4315. https://doi.org/10.1002/joc.5086
Harris, I., Osborn, T. J., Jones, P., & Lister, D. (2020). Version 4 of the CRU TS monthly high-resolution gridded multivariate climate dataset. Scientific Data, 7(1), 109. https://doi.org/10.1038/s41597-020-0453-3
Eyring, V., Bony, S., Meehl, G. A., Senior, C. A., Stevens, B., Stouffer, R. J., & Taylor, K. E. (2016). Overview of the Coupled Model Intercomparison Project Phase 6 (CMIP6) experimental design and organization. Geoscientific Model Development, 9(5), 1937–1958. https://doi.org/10.5194/gmd-9-1937-2016