7 Logônia
Logônia is a NetLogo model that simulates the growth response of a fictional plant, logônia, under different climatic conditions. The model uses climate data from WorldClim 2.1 and demonstrates how to integrate the LogoClim model through the LevelSpace extension.
The model can be downloaded from the CoMSES Network or accessed on GitHub.
We’re going Logônia as a case study to illustrate how to set up and run a model using LogoClim in NetLogo. The model is designed to be simple and educational, allowing users to understand the key concepts of integrating climate data into agent-based models.
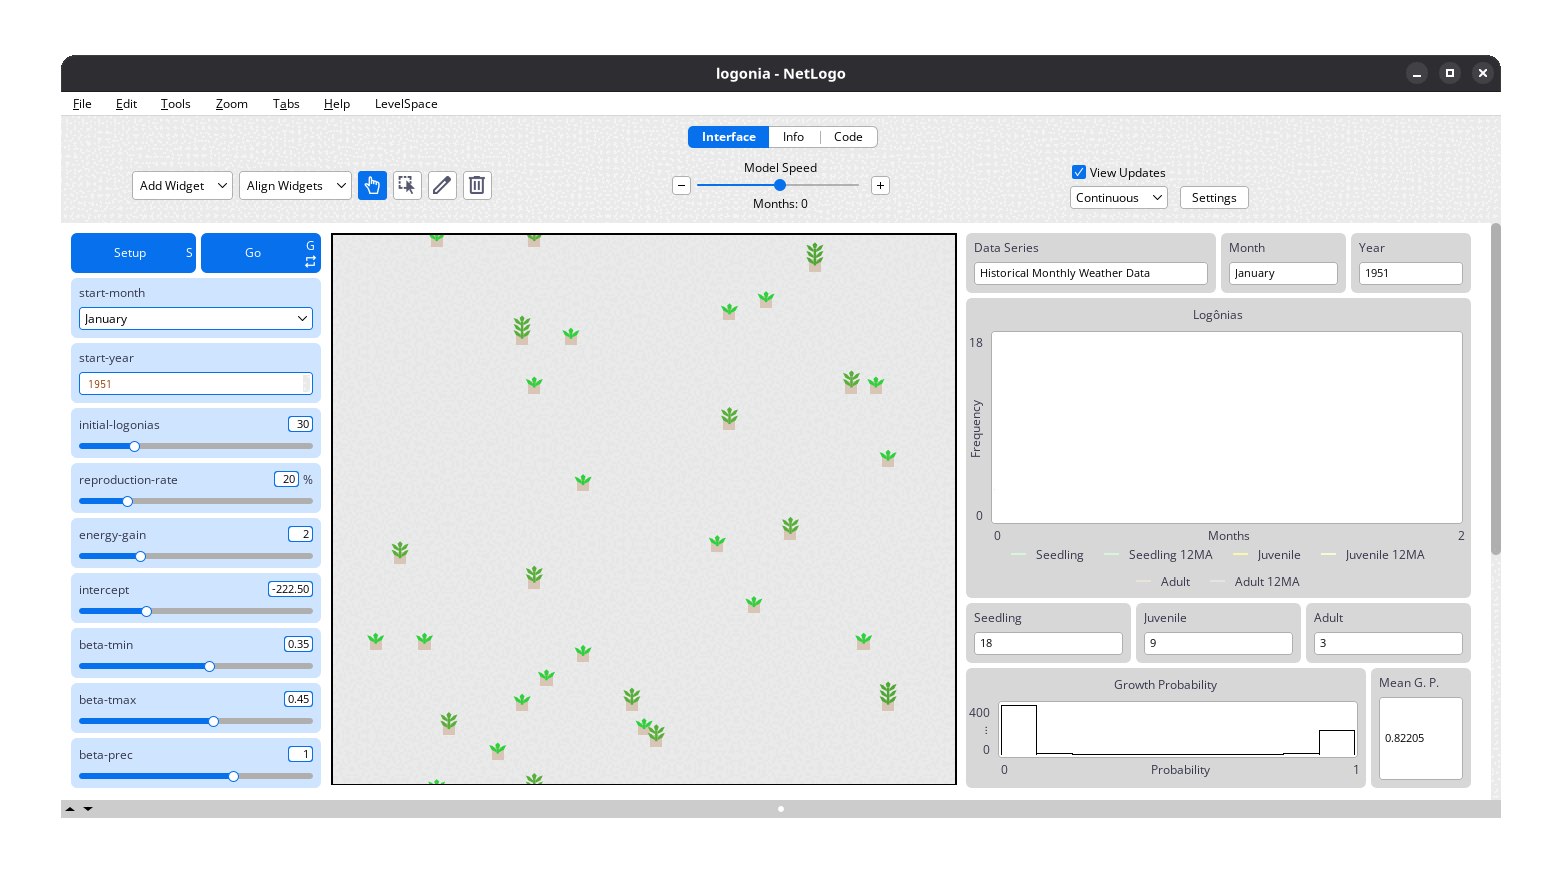
Logônia’s interface. Click on the image to enlarge it.
7.1 How It Works
Logônia runs on a grid of patches, where each patch represents a piece of soil that can host a plant. Patches correspond to a specific geographic area and store historical climate data.
Each simulation step represents one month. Over time, plants grow, reproduce, and age. These processes are controlled by sliders on the model’s interface (described below). Climate conditions directly influence growth probability, adding realism and complexity to the simulation.
We will not go through the details of this dynamics here, but you can explore it in Logônia documentation. Instead, we will focus on how to import the climate data and set up the model using LogoClim and LevelSpace.

Logônia plants at different stages of growth and aging, as they evolve over the course of a simulation. Click on the image to enlarge it.
7.2 Climate Data
The model uses Historical Monthly Weather Data from WorldClim 2.1 for a region of the Brazilian Amazon Forest. This dataset provides 12 monthly values per year for 1951–2024, based on downscaled data from CRU-TS-4.09.
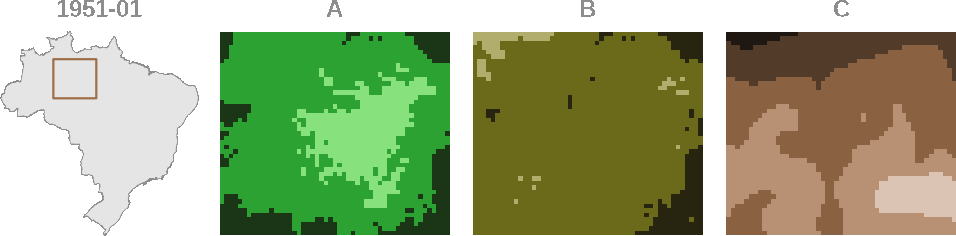
Logônia model uses this data to simulate how plants respond to changing climate conditions. Click on the image to enlarge it.
7.3 Integration
To integrate LogoClim into Logônia, we will follow 5 main steps:
-
Interface: Organize the model’s interface to include
LogoClimcontrols and displays.
-
Interface: Organize the model’s interface to include
-
Global Variables: Define global variables to store
LogoClimmodels and settings.
-
Global Variables: Define global variables to store
- Patch Attributes: Set up patch attributes to hold climate data for each patch.
-
Setup Procedure: Implement the
setupprocedure to initializeLogoClimmodels and load climate data into patches.
-
Setup Procedure: Implement the
-
Go Procedure: Implement the
goprocedure to updateLogoClimmodels and apply climate data to patch dynamics.
-
Go Procedure: Implement the
These steps will be detailed in the following sections, with code snippets and explanations to guide you through the process.