1 How It Works
LogoClim uses raster data to represent climate variables such as temperature and precipitation over time. It incorporates historical data (1951-2024) and future climate projections (2021-2100) derived from global climate models under various Shared Socioeconomic Pathways (SSPs) (O’Neill et al., 2017).
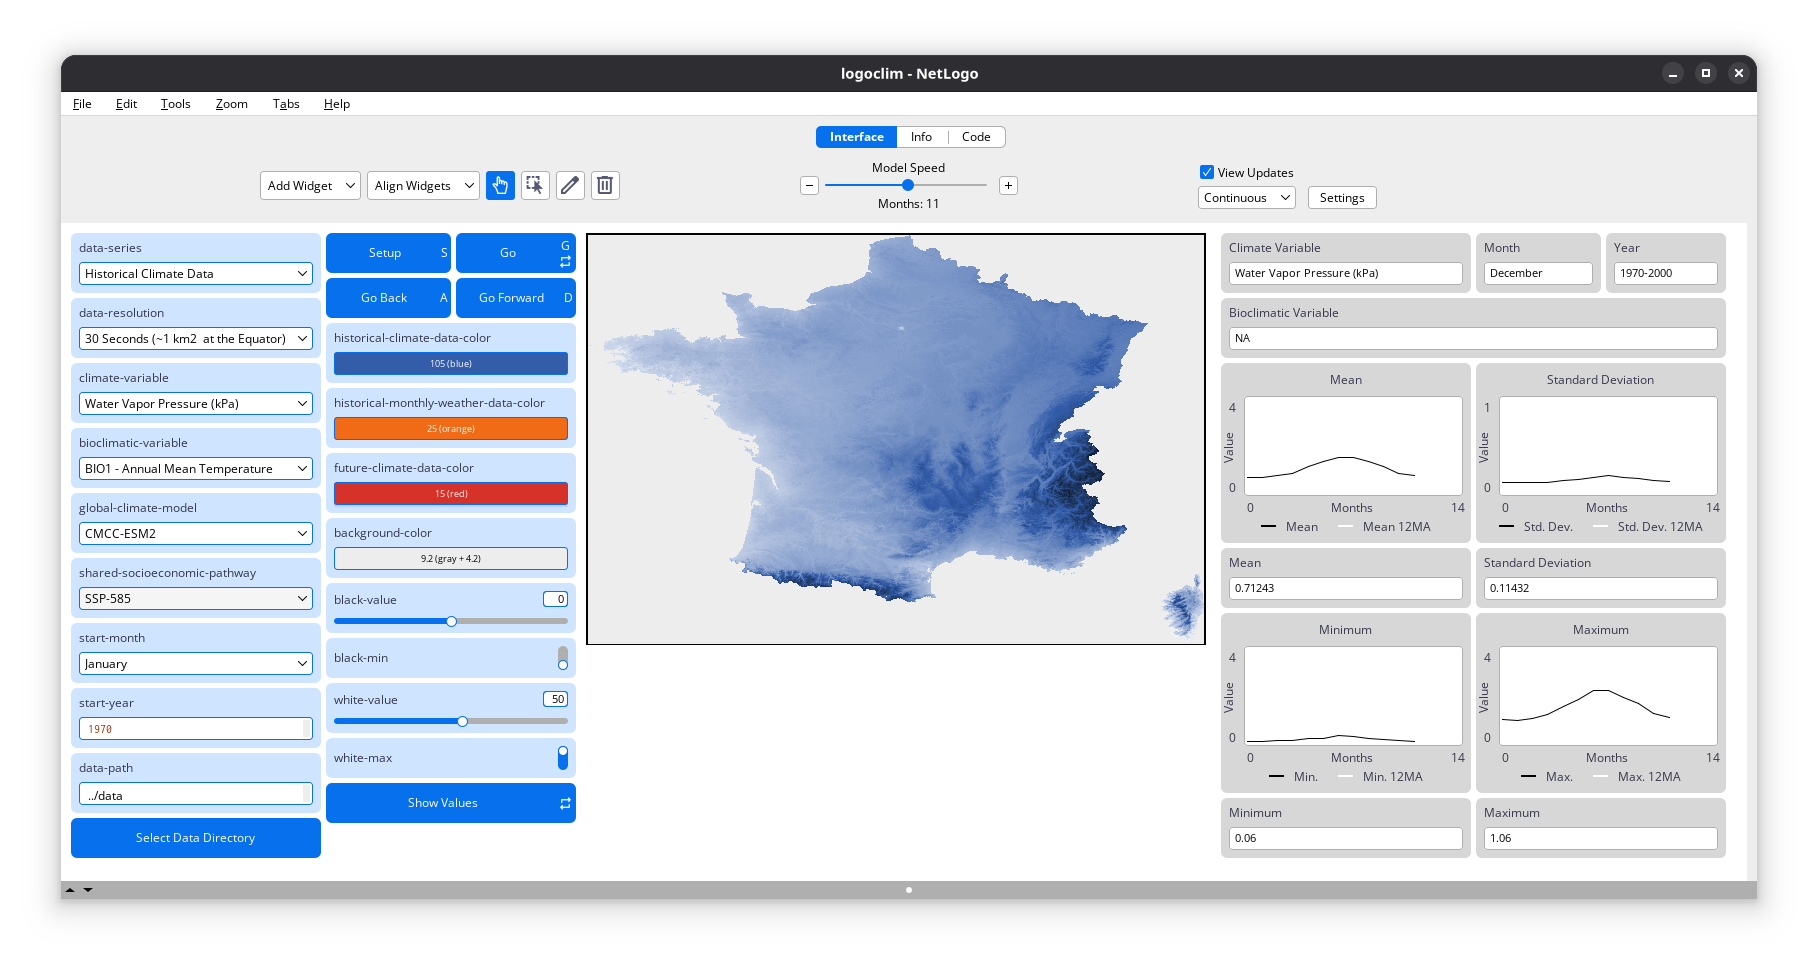
The model operates on a grid of patches, where each patch represents a geographical area and stores values for latitude, longitude, and selected climate variables. During the simulation, patches update their colors based on the data values. The results can be visualized on a map, accompanied by plots that display the mean, minimum, maximum, and standard deviation of the selected variable over time.
All climate inputs come from WorldClim 2.1, a widely used source of high-resolution climate datasets based on weather station observations worldwide (Fick & Hijmans, 2017). These data series are offered at various spatial resolutions, ranging from 10 minutes (~340 km² at the equator) to 30 seconds (~1 km² at the equator), and can be chosen within the model interface.
Learn more about the data series in the WorldClim section.